
Crop Insurance decisions are closely tied to farmer’s risk preferences. Each producer faces different circumstances and has a different risk tolerance. Some producers prioritize revenue stability and opt for higher coverage levels and choose optional units for more targeted coverage. Conversely, others may be able to tolerate more risk and choose lower coverage levels or utilize basic or enterprise units in exchange for lower premiums. Crop insurance decisions can be overwhelming as the full suite of protection also involves choices on the FSA programs (ARC or PLC), crop insurance product, unit structure, and coverage level. Each of these choices need to made taking into account producer risk preference.
In discussing the effects of risk on crop insurance decisions, we use an online application, “Crop Insurance Decision Maker, ” which can be found here. A set of example results for Christian County, Kentucky, can be seen in Figure 1. In our case example, we look at insurance on non-irrigated corn acreage using enterprise units. The case example illustrates that as the coverage level increases, average net revenues increase. Among the three main crop insurance products (YP, RP, RP-HPE), Revenue Protection (RP) consistently yields the highest net revenues, followed by Yield Protection (YP) and then Revenue Protection with a Harvest Price Exclusion (RP-HPE). This suggests that on the example farm, higher levels of coverage generally lead to better average net revenues ($/acre), with RP providing the most significant benefit.
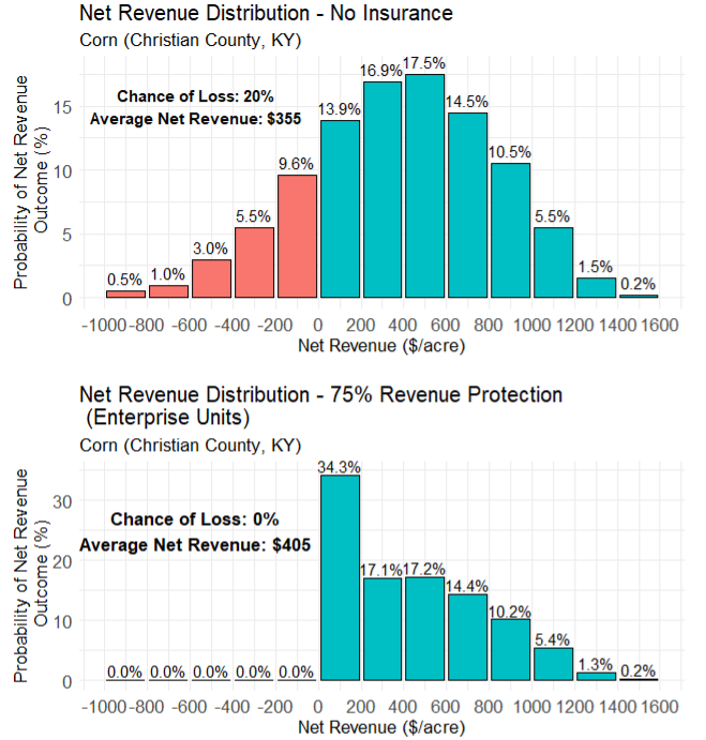
The fact that average net revenue increases with coverage level may seem counterintuitive but is evidence of the effect of a reduction in the actuarially fair insurance premium. To discuss this point, we use Figure 2, which compares the net revenue distributions for Christian County, Kentucky, utilizing no crop insurance and a 75% RP plan utilizing Enterprise Units. Figure 2 indicates that with no crop insurance, a producer faces a 20% chance of net revenues less than zero which is the downside risk a producer wants to minimize or eliminate. Conversely, the 75% coverage level in this example eliminates the downside risk of negative net revenues while slightly reducing the likelihood of larger returns. Due to the protection offered, net income increases on average. That is, the downside risk reduction outweighs the reduction in the upside potential driven by the producer paid premium.
Our comparisons in Figure 1 and Figure 2 should be considered for each insurance decision. Net revenue probabilities change each time a crop insurance product, unit structure, or FSA program is changed. Each producer needs to determine their risk preference as under-insuring could leave the producer vulnerable to losses. Still, over-insuring could limit net income in years when indemnities are not triggered. The “Crop Insurance Decision Maker” aims to make these choices easier. It is important to note that the effects of each crop insurance decision change by county depending upon premiums, and the results for Christian County, Kentucky, may not hold for your operation.
Figure 1: Crop Insurance Decision Maker Web Application Output
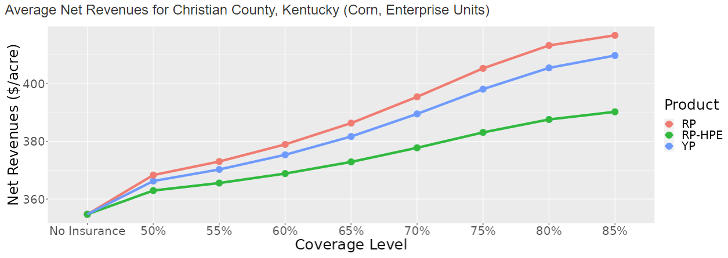
Figure 2: Net Revenue Distribution for No Insurance VS a 75% Revenue Protection Plan using Enterprise Units
References
Biram, Hunter D., et al. “Mitigating price and yield risk using revenue protection and agriculture risk coverage.” Journal of Agricultural and Applied Economics 54.2 (2022): 319-333.
Maples, William E., et al. “Impact of government programs on producer demand for hedging.” Applied Economic Perspectives and Policy 44.3 (2022): 1126-1138.
Article courtesy of Southern Ag Today :Serrano, Enil, Grant Gardner, and Hunter Biram. “Using Risk Preference to Inform Crop Insurance Decision-Making.” Southern Ag Today 4(29.3). July 17, 2024. Permalink