
The United States Department of Agriculture National Agricultural Statistics Service (USDA-NASS) releases monthly indexes for input prices paid and output prices received. These indexes include collecting survey responses for output and input prices for agricultural production, crops, livestock, and food commodities. The spread between these two indices often helps understand where farmers are getting price squeezed and how their profit margins are impacted. Current farm income instability from inflationary pressures, high interest rates, and several supply chain disruptions (e.g., the Russian-Ukraine war and Panama/Suez Canal) are forcing farmers to pay higher input costs while receiving lower commodity prices, emphasizing the need to consider these indexes into the future.
These price indices measure the change in prices paid (and received) relative to a point in time—2011 in this case (Figure 1). The base year is often chosen during a time without prevailing inflation or major supply chain disruptions (Schulz, 2022). 2011 was a good year for agricultural production and profitability. As such, using 2011 as a base year is a way to highlight how better or worse-off agricultural producers are compared to a good year.
Figure 1. Crop Output Prices Received vs. Input Prices Paid
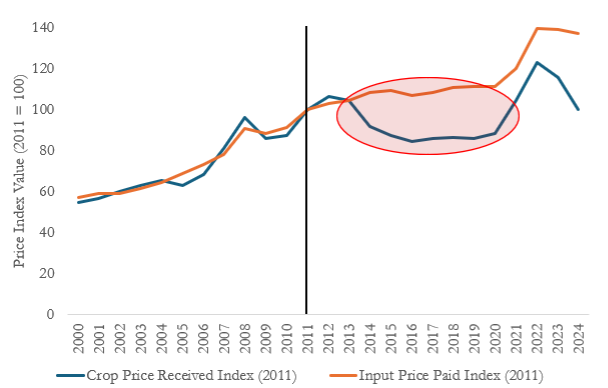
Figure 1 compares the annual index value from 2000-2024 for the two indices with 2011 as the base year. The price received index in 2012 was 102.8%, meaning that the crop price received, on average, in 2012 was 2.8% higher than in 2011 (base year = 100%). The red circle in Figure 1 shows the beginning of a divergence between input and output prices. In 2013, when writing the 2014 farm bill, the index for input prices paid was almost exactly the index for output prices received. This is where most of our current farmer safety net support stems from, and since then, we’ve seen a major divergence in the two indices, with the widest gaps between 2014 – 2020 (USDA-NASS). From 2021 – 2022, we saw both indices increase, but the gap remained, and the divergence has grown wider in 2023 and 2024 due to declining commodity prices.
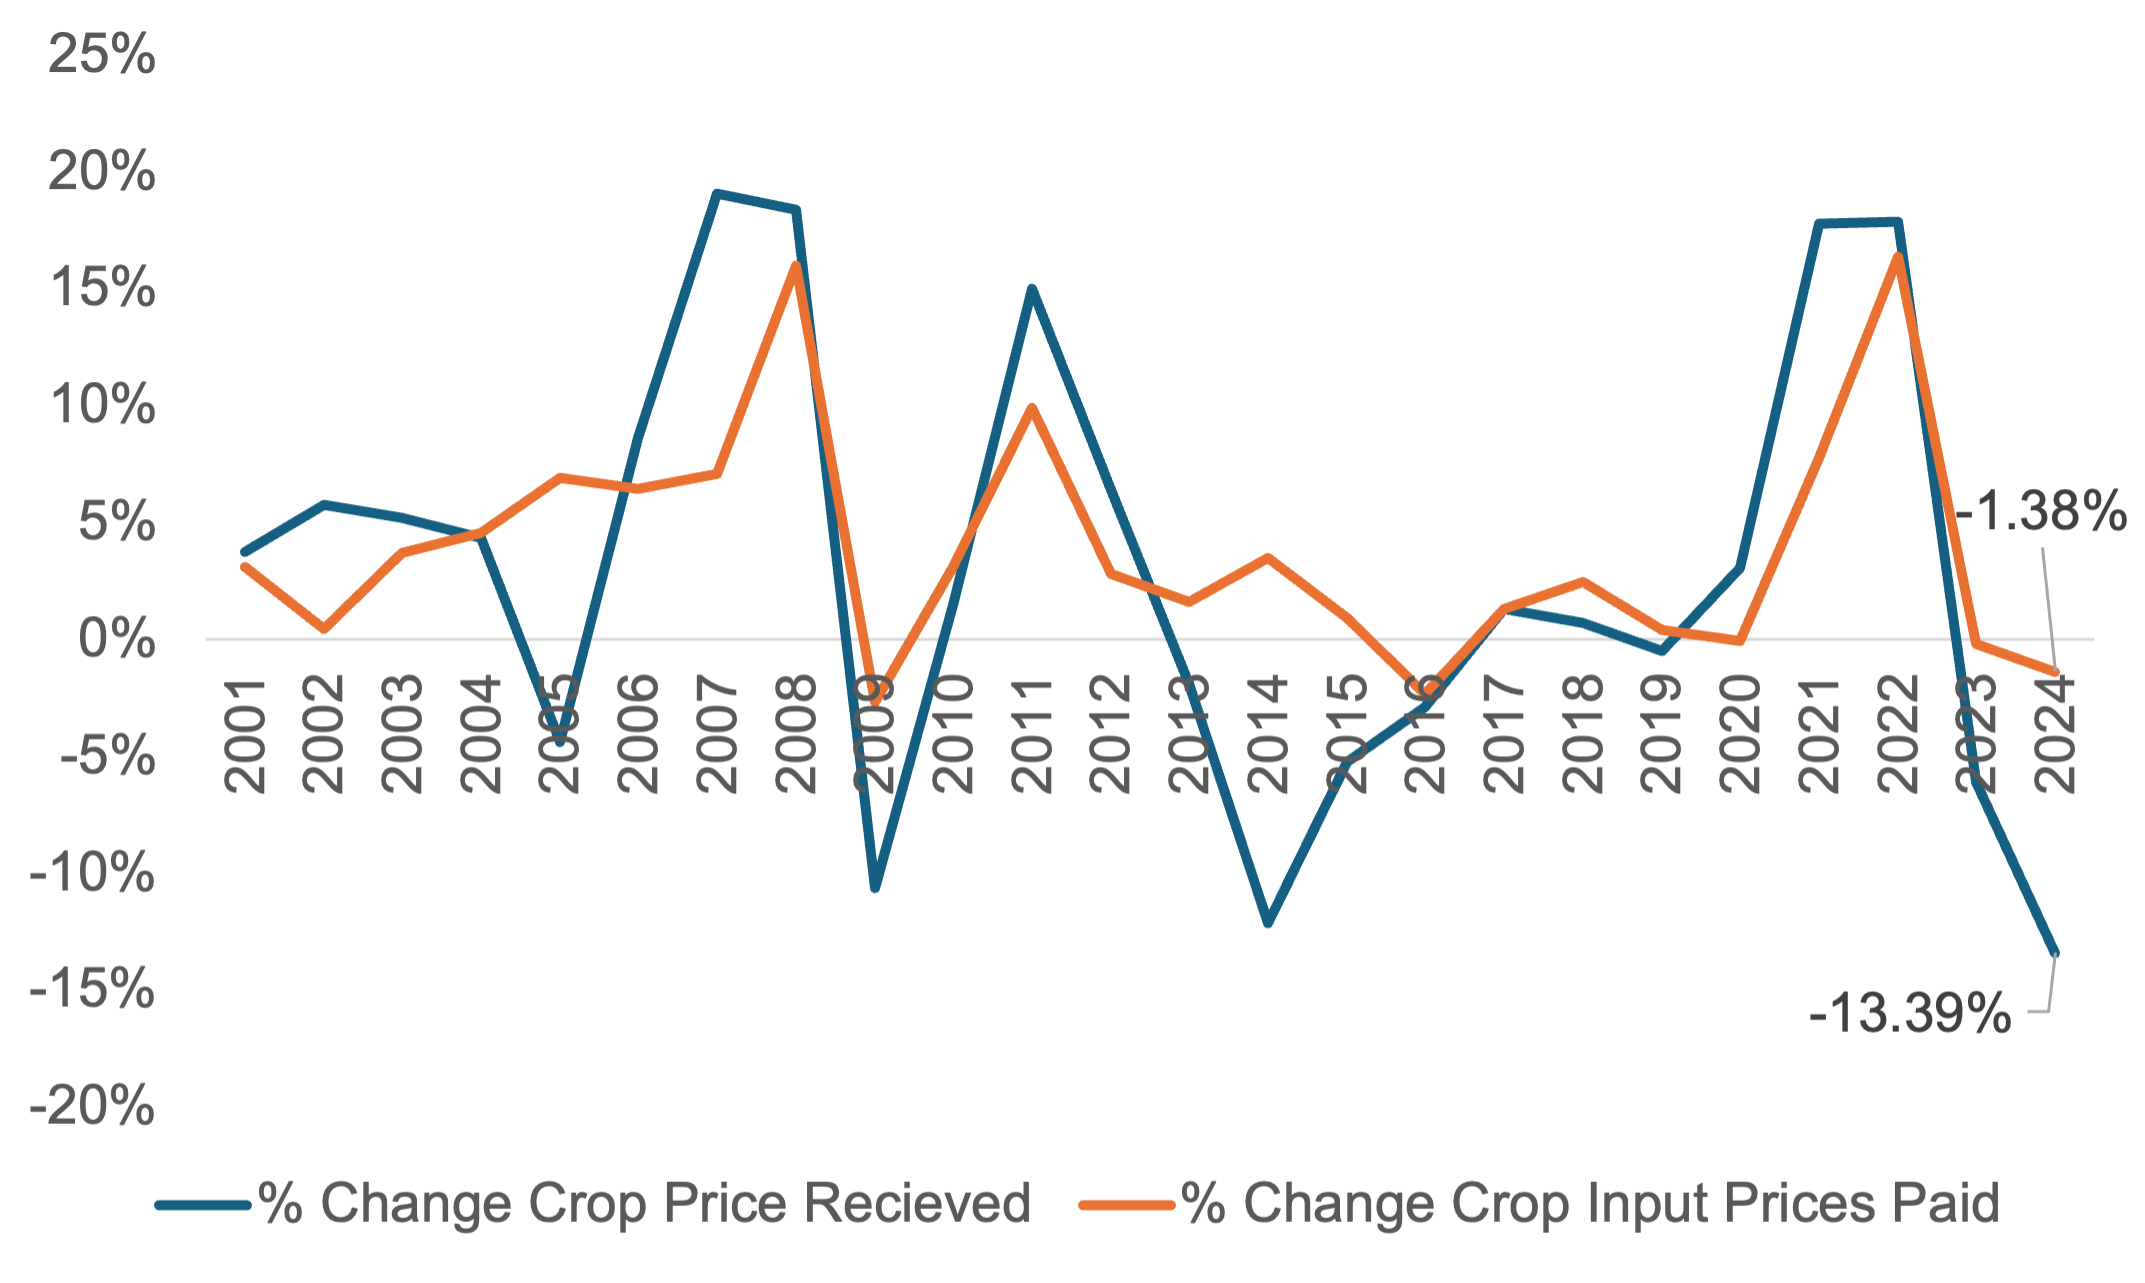
Another way to view the indices is to calculate how they change year to year. Figure 2 plots the same indices as Figure 1 but shows the yearly change between the index values. Using this percentage change helps producers understand 1) the volatility of crop output prices and 2) the magnitude of change as compared to the previous year. A key takeaway is that input prices are less volatile (in terms of yearly % change) than output prices. Secondly, the percentage change in crop output prices between 2023 and 2024 (-13.8%) is much larger than the percentage decrease in input prices (-1.38%) during that period.
Without any relief in the form of improved crop prices received, figure 1 suggests farmers will continue to suffer from cost/price squeezes and eroding profit margins. Further, figure 2 shows the magnitude of that spread between the indices in Figure 1; if input and output prices continue this trajectory, an improved farm safety net will be warranted. This will be at the forefront of every producer’s mind, with ongoing Farm Bill debates in 2024.
Figure 2. Year-over-Year % Change in Input and Output Crop Prices
References
Schulz, L. (2022). Disentangling Input and Output Price Relationships. Retrieved from: https://www.extension.iastate.edu/agdm/articles/schulz/SchSep22b.html
The Observatory of Economic Complexity (OEC). (2024). Fertilizers in Russia. Retrieved from: https://oec.world/en/profile/bilateral-product/fertilizers/reporter/rus
USDA-Economic Research Service (2024). Farm Sector Income & Finances: Highlights from the Farm Income Forecast. Retrieved from: https://www.ers.usda.gov/topics/farm-economy/farm-sector-income-finances/highlights-from-the-farm-income-forecast/
USDA- Economic, Statistics, and Market Information System. (2024). Agricultural Prices. Retrieved from: https://usda.library.cornell.edu/concern/publications/c821gj76b?locale=en
Article courtesy of: Loy, Ryan, and Hunter Biram. “The Disparity Between Crop Prices Received and Input Prices Paid.” Southern Ag Today 4(28.3). July 10, 2024. Permalink