

Agricultural News
Latest OSU Food Demand Survey Shows Consumers Perceive Chicken Breast Most Healthy and Most Tasty
Fri, 15 Jan 2016 07:44:24 CST
 The January 2016 edition of the Food Demand Survey (FooDS) is now out. The Survey is produced by a team led by Dr. Jayson Lusk of the Ag Economics Department in the Division of Agriculture at Oklahoma State University. The latest report can be seen by clicking here.
According to the Blog written and posted by Jayson Lusk, "Here are a few highlights from the regular tracking portion of the survey:
"Willingness-to-pays (WTP) for all meat products, except pork chops, were down a bit this month compared to last, but were generally higher than was the case a year ago. The changes in WTP were generally small and within the margin of error (which varies across meat products but is typically about +/- 7%).
"On a related note, my paper with Glynn Tonsor, where we used these WTP choice data to estimate demand inter-relationships is now finally out in the journal Applied Economic Perspectives and Policy
"There was a large drop in plans to eat away from home in January compared to December.
"There was also a large drop in awareness of E Coli and Salmonella in the news, and a small drop in concern for these issues as well (a likely Chipotle effect). The same pattern of results was also true for GMOs and antibiotics.
"Two different questions suggested an uptick in concern for farm animal welfare at the beginning of 2016.
"Three new ad hoc questions were added to the survey this month.
"The three questions inquired about consumers' perceptions of taste, health, and safety of the eight different food products for which we track WTP. The first question asked: "How tasty or untasty do you consider the following products, where -5 is very untasty and +5 is very tasty?" Participants were asked the same questions twice more, only the words "tasty or untasty" were replaced with "healthy or unhealthy" and "safe or unsafe"."
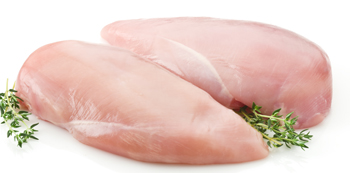
The eight food products that consumers were asked about included, ground beef, steak, pork chops, deli ham, chicken breast, chicken wing, tomato pasta and beans and rice.
Lusk goes on to write "Chicken breast was, on average, perceived as most healthy and as the most tasty. While beans and rice were perceived as the safest option, it was also the least tasty of the eight choices. Participants perceived deli ham was, on average, one of the least healthy, least tasty, and least safe products. Pork chop and chicken wing fell in the middle for each of the three categories. On average, all six meat products were perceived as less safe than the two non-meat products."
He adds "although beef products rate relatively well in terms of taste, they fall well below chicken breast in terms of perceived health. I can use my demand model estimates (the model that gives rise to the WTP values) to do some thought experiments. What if ground beef was perceived as healthy or as tasty as chicken breast? How much would WTP for ground beef increase?
"First, we have to ask how much people value improvements in taste, health, and safety. My model estimates suggest, unsurprisingly, that the higher the perceived taste, health, and safety, the higher the WTP for a product. But, by how much? I find that a 1 unit increase in perceived taste (on the -5 to +5 scale) has about twice the impact on WTP as a 1 unit increase in safety (again on the -5 to +5 scale) and about the 1.4 times the impact on WTP as a 1 unit increase in perceived health (again on a -5 to +5 scale). So, changes in perceived health have a bigger impact than changes in perceived health, which in turn has a bigger impact than changes in perceived safety.
"All that would seem to suggest that meat industry organizations would want to focus on improvements in perceived taste. And that's true. Increasing the perceived taste of pork chops by 1 unit, for example, would increase WTP by $0.36, whereas increasing perceived health by one unit only increases WTP by $0.25 (note: the mean WTP for chops was about $3.94 this month).
"But, it is also important to note that there are larger differences in perceived healthiness across the meat products than there is in perceived taste or safety. This leads me back to the question I asked earlier: What if ground beef was perceived as healthy or as tasty as chicken breast? How much would WTP for ground beef increase? Here are my projections based on the model estimates and average perceptions.
"If ground beef had the same average taste perceptions as chicken breast, WTP for ground beef would increase $0.09. If ground beef had the same average health perceptions as chicken breast, WTP for ground beef would increase $0.45. If ground beef had the same average safety perceptions as chicken breast, WTP would increase $0.11. For reference, average WTP for ground beef was $4.36 this month.
"The last thing I'll note is that it's not all about perceived taste, health, and safety. Average WTP for steak, for example, is about $7.43 whereas average WTP for chicken breast is only $5.34. How is it that people are willing to pay more for steak than chicken breast when they tell us that they think chicken breast is tastier, healthier, and safer? The answer is that people care about other stuff than just these three things. There's just something that makes a steak a steak and a chicken breast a chicken breast that is hard to put in words. Call it "steakyness" (not to be confused with the popular dance move). Of the roughly $2 premium people are willing to pay for steak over chicken breast, about 20% can be explained by taste, health, and safety perceptions, and the other 80% is a desire for "steakyness."
To read the Jayson Lusk blog post and see his graphs- click here.
Details about the Food Demand Survey series and links to all of the surveys dating back three years are available here.
WebReadyTM Powered by WireReady® NSI
Top Agricultural News
More Headlines...