

Agricultural News
Latest U.S. Drought Monitor Map Shows Increasing Dryness In Western Oklahoma
Thu, 23 Apr 2020 15:00:36 CDT
 Abnormal. That's a good way to describe the past 7 days in terms of precipitation and temperature for the central and southern High Plains as reflected in this week's U.S. Drought Monitor map.
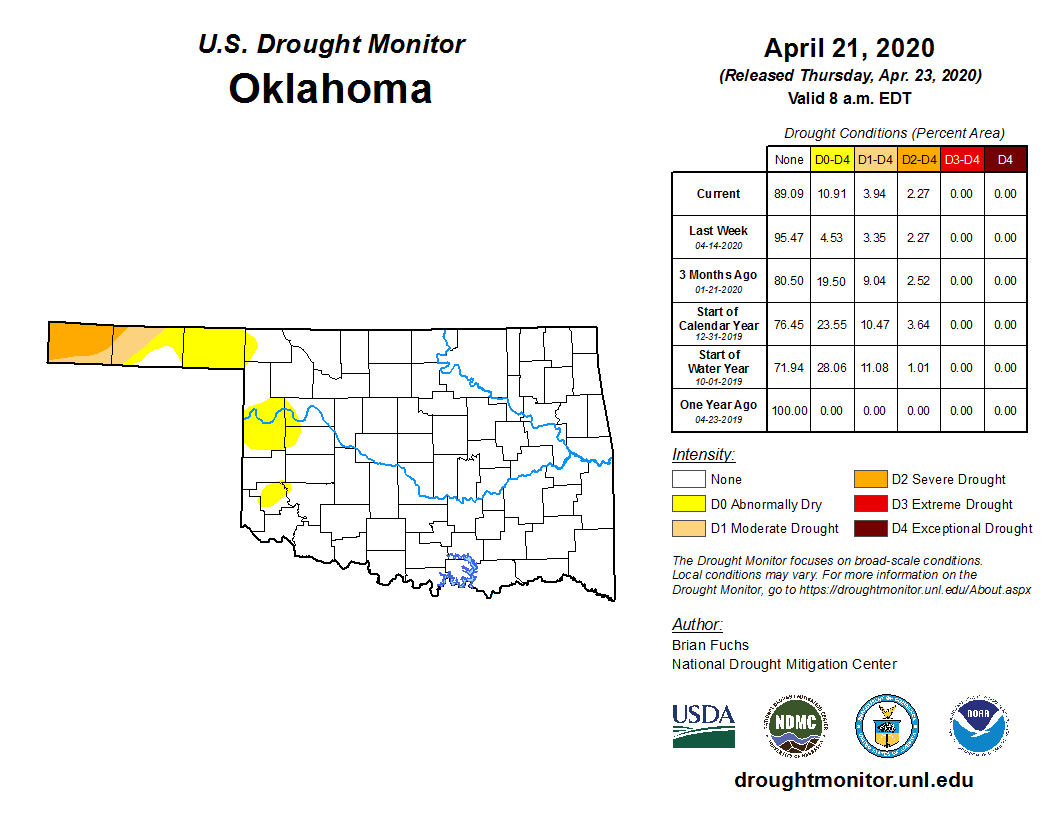
Cooler than normal temperatures, as much as 12 degrees below normal, including some freezing temperatures were common across Kansas, Oklahoma and Texas. Abnormally dry conditions and moderate drought expanded over parts of the Texas and Oklahoma
Panhandles and into southeast Colorado and southwest Kansas.
A new area of abnormally dry conditions popped up in several pockets in northern and southern Kansas.
Rains that fell Wednesday across the Plains drenched already wet areas but did help in the dry pockets. How much it helped is hard to show graphically as the data cutoff for the drought monitor maps is Tuesday morning. No doubt this week's rainstorms will be reflected in next week's map.
The stats for Oklahoma depict a worsening situation for the western region as an area of abnormally dry has snuck into Ellis and Roger Mills Counties. Combined with the Panhandle and Greer County, we now have almost 11 percent of Oklahoma covered in the abnormally dry shade of yellow. This compares to 4.53 percent last week. The moderate to severe drought percentage remains the same as last week.
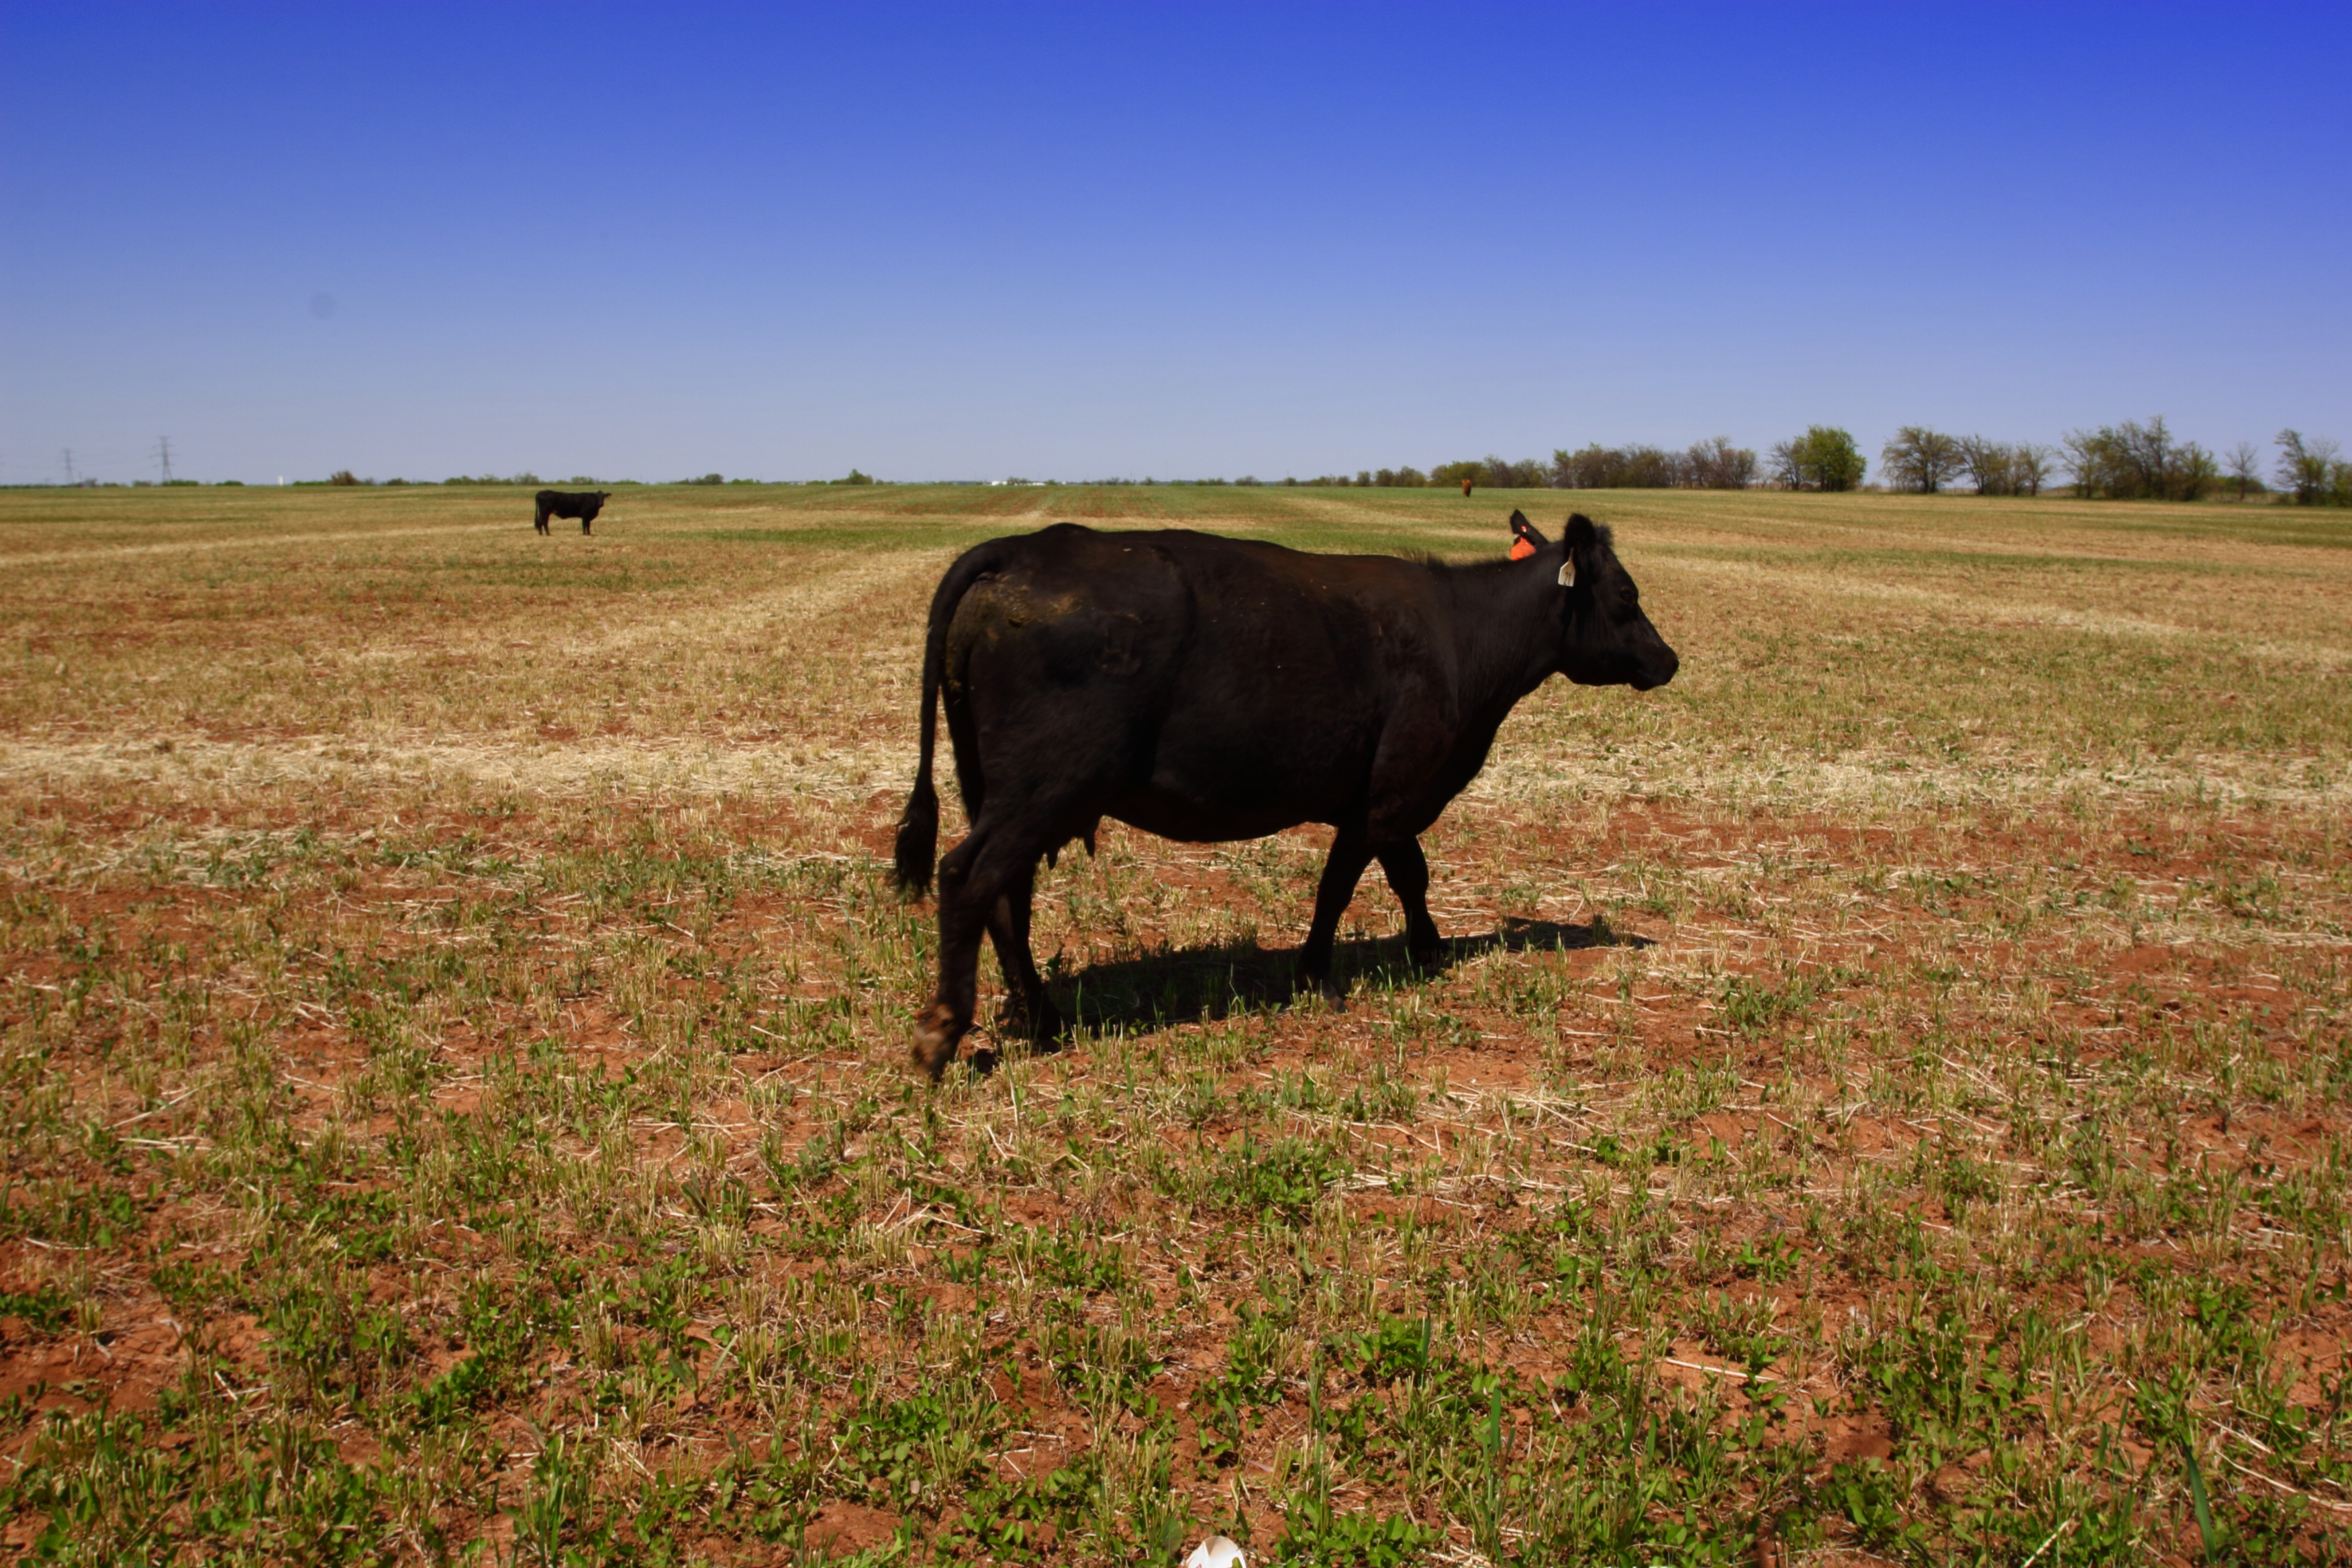
The photo accompanying this story shows cattle grazing a freshly mowed wheat field in west central Oklahoma.
Unfortunately, looking ahead to the next 7 days, the National Weather Service precipitation map does not show much relief for the Oklahoma Panhandle. Click here for the 7-day precip outlook.
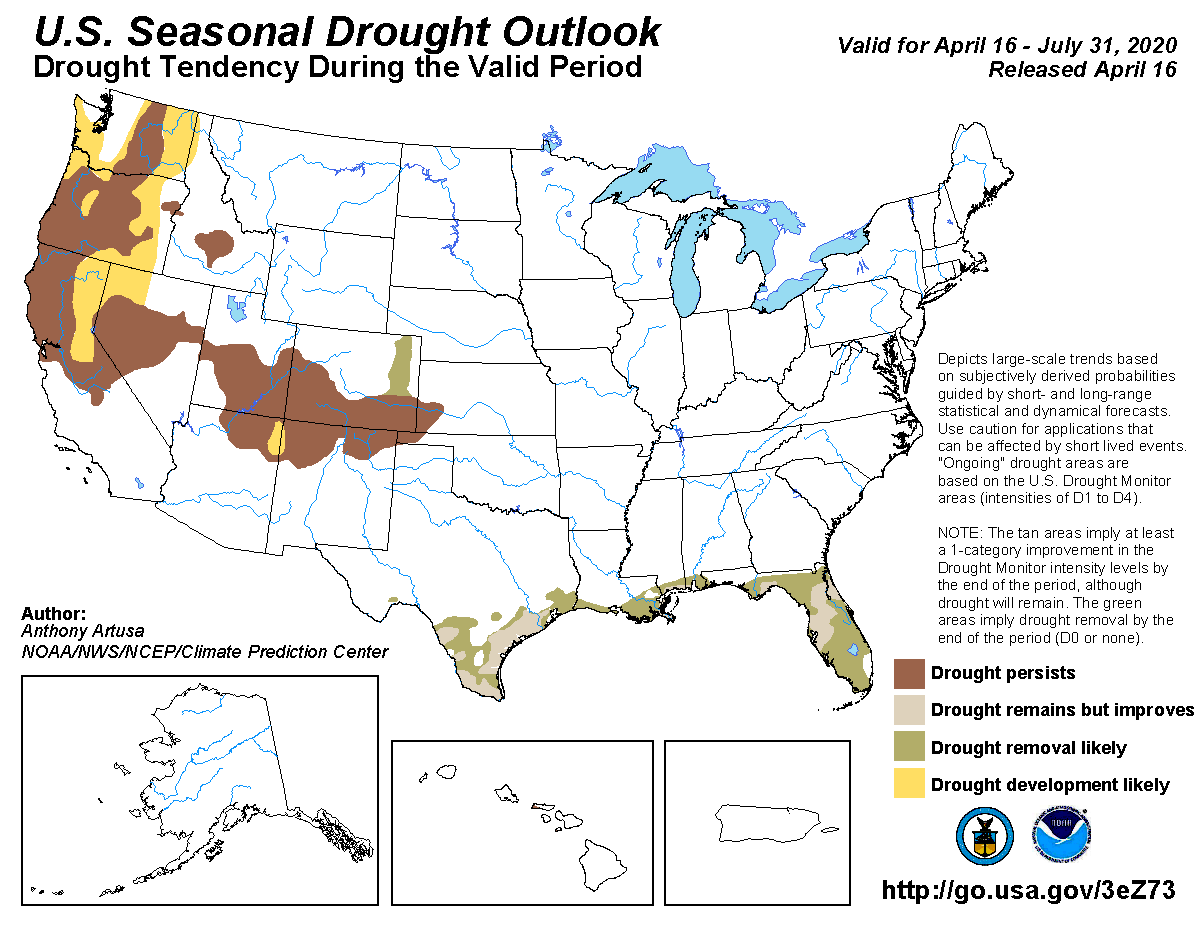
There is some good news (depending on your perspective) In the May 30-day precipitation forecast which calls for above normal amounts for much of the state, including the Panhandle.
Click here for the latest Drought Monitor Map of Oklahoma.
Click here for the U.S. Seasonal Drought Outlook Map.
Click here for the Climate Prediction Center map for May precipitation.
The U.S. Drought Monitor Map is developed through a partnership between the National Drought Mitigation Center at the University of Nebraska-Lincoln, the United States Department of Agriculture, and the National Oceanic and Atmospheric Administration.
WebReadyTM Powered by WireReady® NSI
Top Agricultural News
More Headlines...


