

Agricultural News
Drought Conditions Improve For Much Of Oklahoma, Worsen For Western U.S.
Thu, 03 Sep 2020 15:06:36 CDT
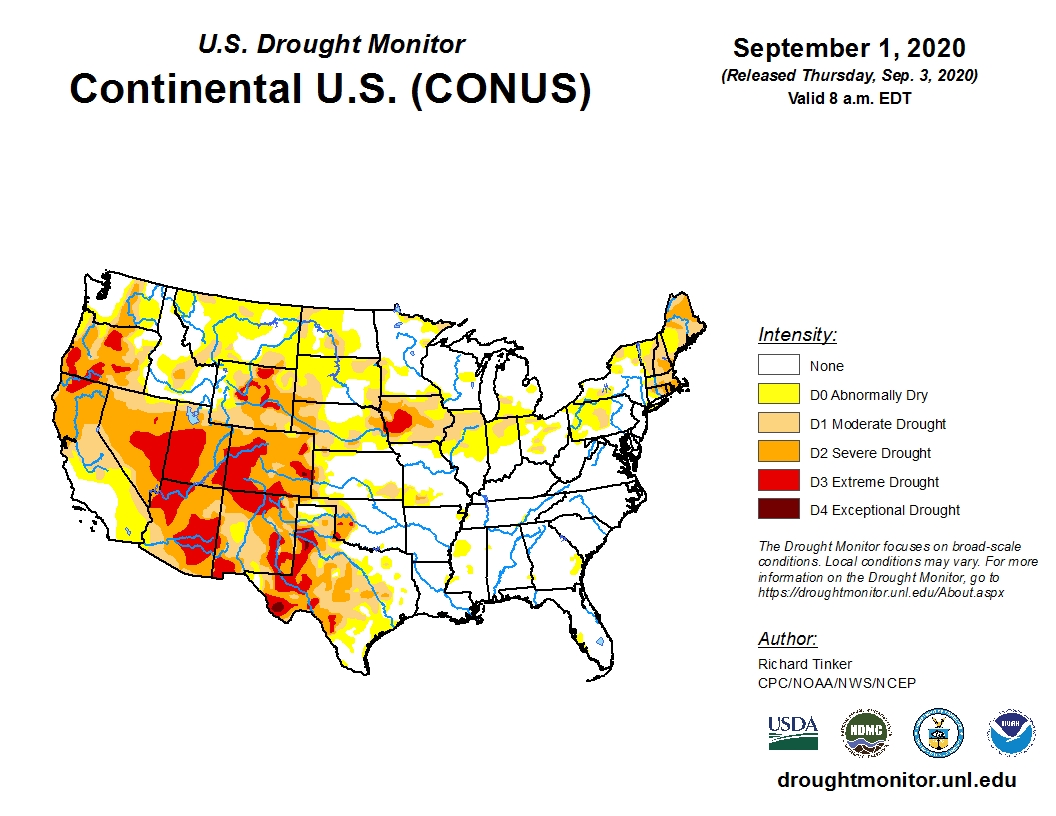
 Expansion of drought conditions in the western half of the U.S. is drawing much of the attention this week on the latest U.S. Drought Monitor map.
This includes a large area covering northern and eastern New Mexico, most of Arizona, Utah, Nevada, northern California, Oregon and central Washington. Most of Colorado and parts of Wyoming are also included in the expanding drought map.
Extreme drought conditions are also continuing for western and central Iowa. In fact, 99 percent of Iowa is covered in D0-D3 (abnormally dry to extreme drought) conditions.
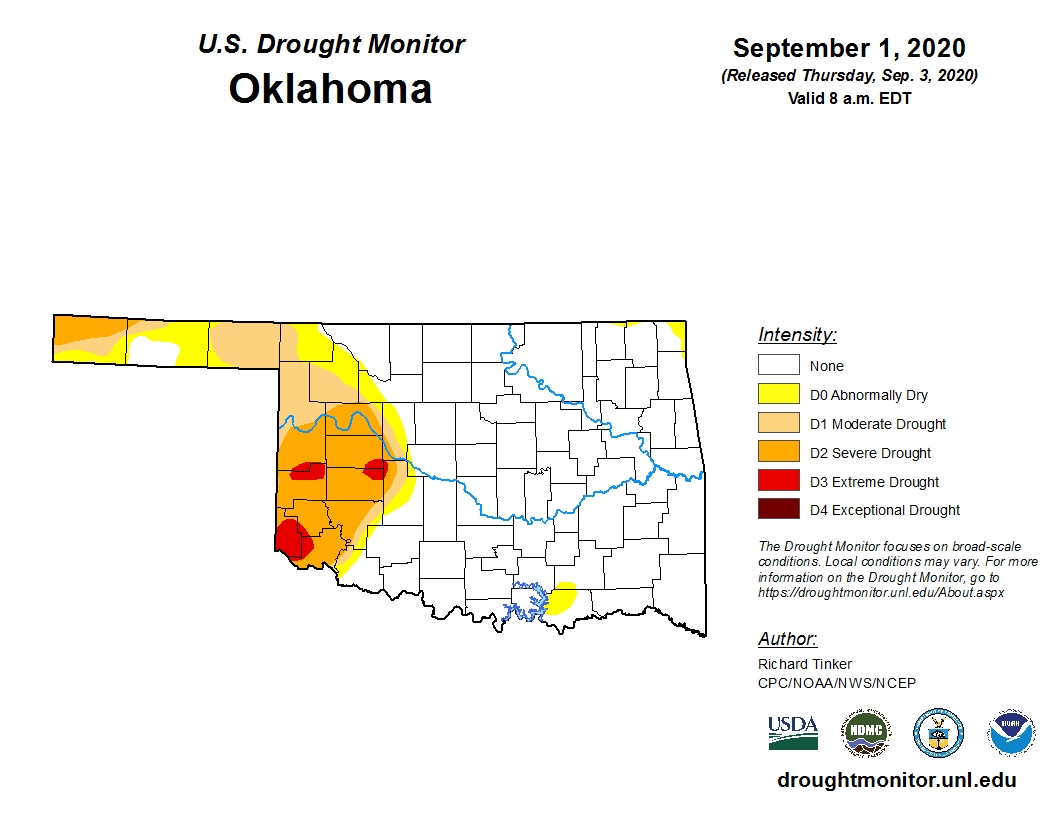
Hurricane Laura left patchy D0 (abnormally dry) conditions from central Oklahoma to eastern Texas. In contrast, serious drought continues to plague western and southwestern Oklahoma, central and western Texas.
Precipitation shortfalls of 4 to 6 inches for the past 60 days and 6 to 8 inches for June-August- cover parts of the Texas Panhandle and over the interior of the Big Bend region of Texas.
Two-to-five-inch deficits for the past 60 days were measured in the rest of central and western Texas while June-August totals 4 to 6 inches less than normal affect most of central Texas and parts of western Oklahoma.
Specifically for Oklahoma, only three spots of red (D3) are showing on the map this week but that doesn't lessen the misery of the folks living in those D3 areas which include all or parts of Harmon, Jackson, Greer, Beckham, Roger Mills, Custer and Dewey Counties.
Thanks to recent rains across the remainder of the state, there has been a 10-point improvement of the amount of the state not suffering from dry conditions. That number now stands at 72.39 percent of the state, the highest percentage all year.
Click here to view the Oklahoma drought map.
Click here for U.S. Drought Monitor map.
Looking ahead, for much of Oklahoma below average precipitation and below average temperatures are forecast.
Click here for 6-10-day temperature outlook.
Click here for 6-10-day precipitation outlook map.
Unfortunately, the drought areas out west are expected to persist and worsen in the coming days and weeks.
Click here for monthly drought outlook map.
Click here for seasonal (now through November) drought outlook map.
The U.S. Drought Monitor Map is developed through a partnership between the National Drought Mitigation Center at the University of Nebraska-Lincoln, the United States Department of Agriculture, and the National Oceanic and Atmospheric Administration.
WebReadyTM Powered by WireReady® NSI
Top Agricultural News
More Headlines...

