
Agricultural News
Dr. Derrell Peel with Feeder Supply Facts
Mon, 08 Feb 2021 09:19:57 CST
 Mondays, Dr. Derrell Peel, Oklahoma State University Extension Livestock Marketing Specialist, offers his economic analysis of the beef cattle industry. This analysis is a part of the weekly series known as the "Cow Calf Corner" published electronically by Dr. Peel and Dr. Glenn Selk. Today, Dr. Peel talks about feeder supply facts.
The Cattle inventory report provides lots of information but does not answer one important question: What is the inventory of feeder cattle available to be placed in feedlots for finishing? We calculate an estimate of the supply of feeder cattle by summing the reported inventories of steers (over 500 lbs.), other (non-breeding) heifers (over 500 lbs.) and calves (under 500 lbs.) and then subtracting the reported inventory of cattle on feed. The resulting value is an estimate of weaned feeder cattle outside of feedlots (in stocker or backgrounding programs) plus unweaned suckling calves.
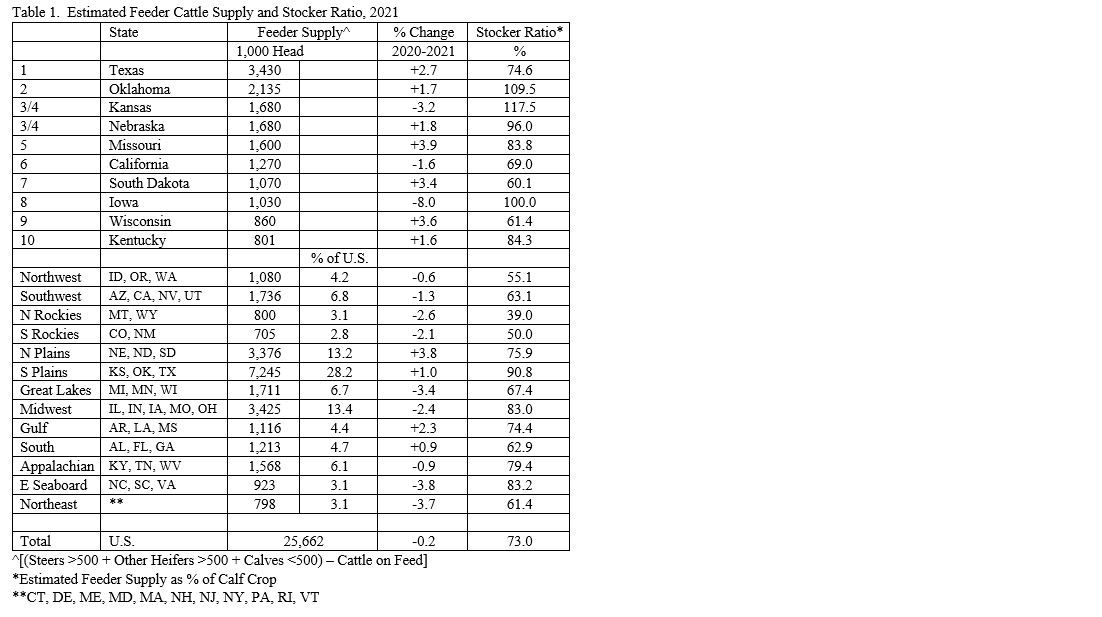
The estimated feeder supply for January 1, 2021 is 25.66 million head, fractionally lower year over year (Table 1). The fact that the 2020 calf crop was down 1.3 percent year over but the estimated feeder supply was only down 0.2 percent compared to last year indicates that a larger proportion of calves and yearlings were carried over from 2020 into 2021. This is consistent with the fact that total feedlot placements were down 4.1 percent in 2020.
Feeder cattle supplies are starting the year relatively large but are expected to decrease as 2021 progresses. However, the cattle on feed inventory on January 1 (14.71 million head) is a record 57.3 percent of the feeder cattle supply. This means there are less than two head of feeder cattle available outside feedlots for every animal currently on feed. This ratio has averaged 53.3 percent in the last decade and is up from less than 40 percent three decades ago. This indicates that cattle are being used much more intensively over time.
The stocker ratio is calculated as the feeder supply as a percent of previous year calf crop and is 0.737 or 73.7 percent for the U.S. in this report. This means that after replacement heifers, veal slaughter and feedlot placement of calves are accounted for, 73.7 percent of last year's calf crop is still available as feeder supply.
The January Cattle report also provides detailed information for all states. (This is the only time such information is available; The July cattle report is national level only.) Table 1 shows estimated feeder supplies and stocker ratios for the top ten states and for regions of the U.S. Feeder supplies are largest in Texas, Oklahoma and Kansas. These three states (designated the Southern Plains) account for over 28 percent of total feeder supplies. The Northern Plains and Midwest regions also have large inventories of feeder cattle.
States with stocker ratios well over the U.S. average of 73.7 percent indicate net inflows of cattle for stocker and backgrounding operations. The highest stocker ratios are found in Kansas, Iowa, Oklahoma and Nebraska. By contrast, some states keep only small percentages of their calf crops and are net exporters to stocker states. Montana has lowest stocker ratio of any state at 34.8 percent. The northern and southern Rockies, the Northwest, Southwest and the South have low stocker ratios. This indicates the general flow of stocker and feeder cattle to the middle of the country on their way to feedlots.
WebReadyTM Powered by WireReady® NSI
Top Agricultural News
More Headlines...